
MARCH 2025 MARKET COMMENTARY
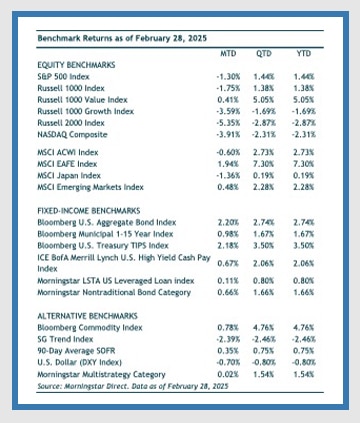
THE MONTH AT-A-GLANCE
- The S&P 500 notched a new all-time high in mid-February but quickly gave up those gains over the final week of the month.
- Softer economic data points and hotter inflation readings in February drove stagflationary concerns (slow economic growth with elevated inflation).
- Increasing uncertainty around tariffs, immigration, federal layoffs, and the Ukraine-Russia War drove investor sentiment lower.
- The longer end of the U.S. Treasury yield curve fell during month with the 10-year yield dropping below the three-month rate, once again inverting the yield curve.
MARKET RECAP
The “U.S. exceptionalism” narrative lost some steam in February. The U.S. dollar (DXY Index) fell 0.7% and U.S. equities trailed foreign equities. The S&P 500 dropped 1.3% compared to gains of 1.9% for MSCI EAFE and 0.5% for MSCI Emerging Markets. Developed international stocks (MSCI EAFE Index) 3%-plus outperformance of U.S. stocks (S&P 500 Index) was the largest monthly outperformance since late 2022.
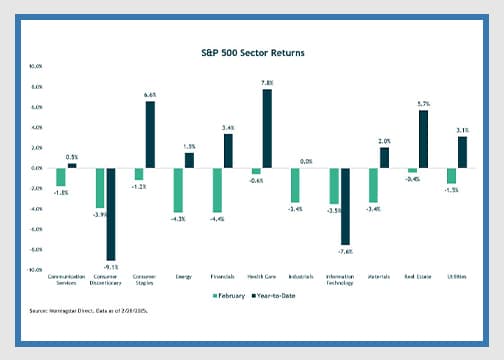
Within the U.S., large-cap value stocks (Russell 1k Value Index) outpaced growth stocks (Russell 1k Growth Index). More traditionally defensive sectors outperformed in February—with utilities, health care, and consumer staples all declining less than the overall benchmark. Cyclically sensitive sectors such as consumer discretionary, energy, financials, industrials, and technology led the markets lower. Small-cap stocks (Russell 2000 Index) fared worse than large-caps (S&P 500 Index), losing 5.4%.
The recent sector rotation away from mega-cap technology/growth stocks continued during the month. The Bloomberg Magnificent 7 Index is largely unchanged over the past several months and some of these names have fallen into bear market territory (>10% loss) this year. The emergence of China’s DeepSeek large language model in late January appears to be one key reason behind less exuberance around these stocks. Elevated valuations amid growing economic concerns also put some downward pressure on these stocks.
Fixed Income
Fixed income was positive across almost all segments in February. Gains were driven by declining yields that were influenced by uncertainty around economic data and trade policies and weakening investor sentiment. Treasury yields across various maturities fell during the month.
The 2-year Treasury yield decreased by 23 basis points, falling just below the 4% level, while the 10-year yield fell by 34 basis points, ending the month at 4.22%. This decline occurred despite a higher-than-expected increase in the Consumer Price Index (CPI), which rose by 0.5% in January, surpassing the anticipated 0.3% and bringing the year-over-year inflation rate to 3%. Investment-grade corporate bonds (Bloomberg US Aggregate Bond Index) delivered positive returns, benefiting from the overall decline in yields. High-yield corporate bonds (ICE BofA Merrill Lynch High Yield) gained 0.65%, reflecting investor confidence in the general health of corporate America.
When thinking about the direction of rates across the curve, we know that short-term rates are driven by the Fed. Here, the market’s expectations for the number of rate cuts in 2025 has been fluctuating between one and three cuts as the market grapples with economic uncertainties. Looking farther out at the curve, Treasury Secretary Scott Bessent has been vocal about bringing the 10-year Treasury yield lower, which has dropped approximately 35 basis points since the beginning of the year.
Bessent has emphasized the administration’s commitment to managing the 10-year U.S. Treasury yield, aiming to prevent it from exceeding 5%. This threshold is viewed as critical, as higher rates could negatively impact stocks, housing, and other rate-sensitive sectors. To achieve this, the administration is focusing on fiscal measures rather than pressuring the Federal Reserve for rate cuts. Bessent highlights policies such as deregulation, tax reforms, and reducing energy costs are intended to naturally lower interest rates and stabilize the dollar. However, there is some skepticism regarding the effectiveness of these strategies which could be inflationary and thereby counteracting efforts to contain long-term Treasury yields.
Economic Data
Growing uncertainty around the impact from tariffs, immigration, government spending, and the ongoing war in Ukraine is set to test what has been a very resilient U.S. economy. Indeed, softer economic data and a higher-than-expected inflation reading sparked concerns.
The January jobs report came in weaker than expectations. Nonfarm payrolls showed the U.S. economy added 143,000 jobs in January versus an anticipated 175,000 jobs. Despite the slowdown in hiring, the unemployment rate inched down to 4%. Meanwhile, real wage growth remained positive for the 21st consecutive month, i.e., wage growth has been outpacing inflation, which generally bodes well for consumer spending and the overall economy.
With consumers driving the economy over the last few years, January’s consumer expenditures data was weaker-than-expected. Real personal consumption expenditures (PCE) fell by 0.5% in January, which was the second largest drop in the current economic expansion (chart below). There was a meaningful drop in real durables spending—while services spending was up just 0.1%, the smallest monthly gain in two years.
DISCLOSURE:
For discretionary use by investment professionals. Portions of this document are provided by iM Global Partner Fund Management, LLC (“iMGPFM”) for informational purposes only and no statement is to be construed as a solicitation or offer to buy or sell a security, or the rendering of personalized investment advice. There is no agreement or understanding that iMGPFM will provide individual advice to any investor or advisory client in receipt of this document. Certain information constitutes “forward-looking statements” and due to various risks and uncertainties actual events or results may differ from those projected. Some information contained in this report may be derived from sources that we believe to be reliable; however, we do not guarantee the accuracy or timeliness of such information. Investing involves risk, including the potential loss of principal. Any reference to a market index is included for illustrative purposes only, as an index is not a security in which an investment can be made. Indexes are unmanaged vehicles that do not account for the deduction of fees and expenses generally associated with investable products. A list of all recommendations made by iMGPFM within the immediately preceding one year is available upon request at no charge. For additional information about iMGPFM, please consult the Firm’s Form ADV disclosure documents, the most recent versions of which are available on the SEC’s Investment Adviser Public Disclosure website (adviserinfo.sec.gov) and may otherwise be made available upon written request.
Certain material in this work is proprietary to and copyrighted by iM Global Partner Fund Management, LLC and is used by OJM Group with permission. Reproduction or distribution of this material is prohibited and all rights are reserved.
For informational purposes only. OJM Group, LLC is an investment adviser registered under the Investment Advisers Act of 1940. Registration as an investment adviser does not imply any level of skill or training. For more information about OJM Group please visit https://adviserinfo.sec.gov/ or contact us at 877-656-4362. Not intended as legal or investment advice or a recommendation of any particular security or strategy. Information prepared from third-party sources is believed to be reliable though its accuracy is not guaranteed. Investing involves risk and possible loss of principal capital. Past performance is not indicative of future results.
Index Disclosure: An index is an unmanaged portfolio of specific securities, the performance of which is often used as a benchmark in judging the relative performance of certain asset classes. Investors cannot invest directly in an index. An index does not charge management fees or brokerage expenses, and no such fees or expenses were deducted from the performance shown. Index returns shown are price returns, which exclude dividends and other earnings.